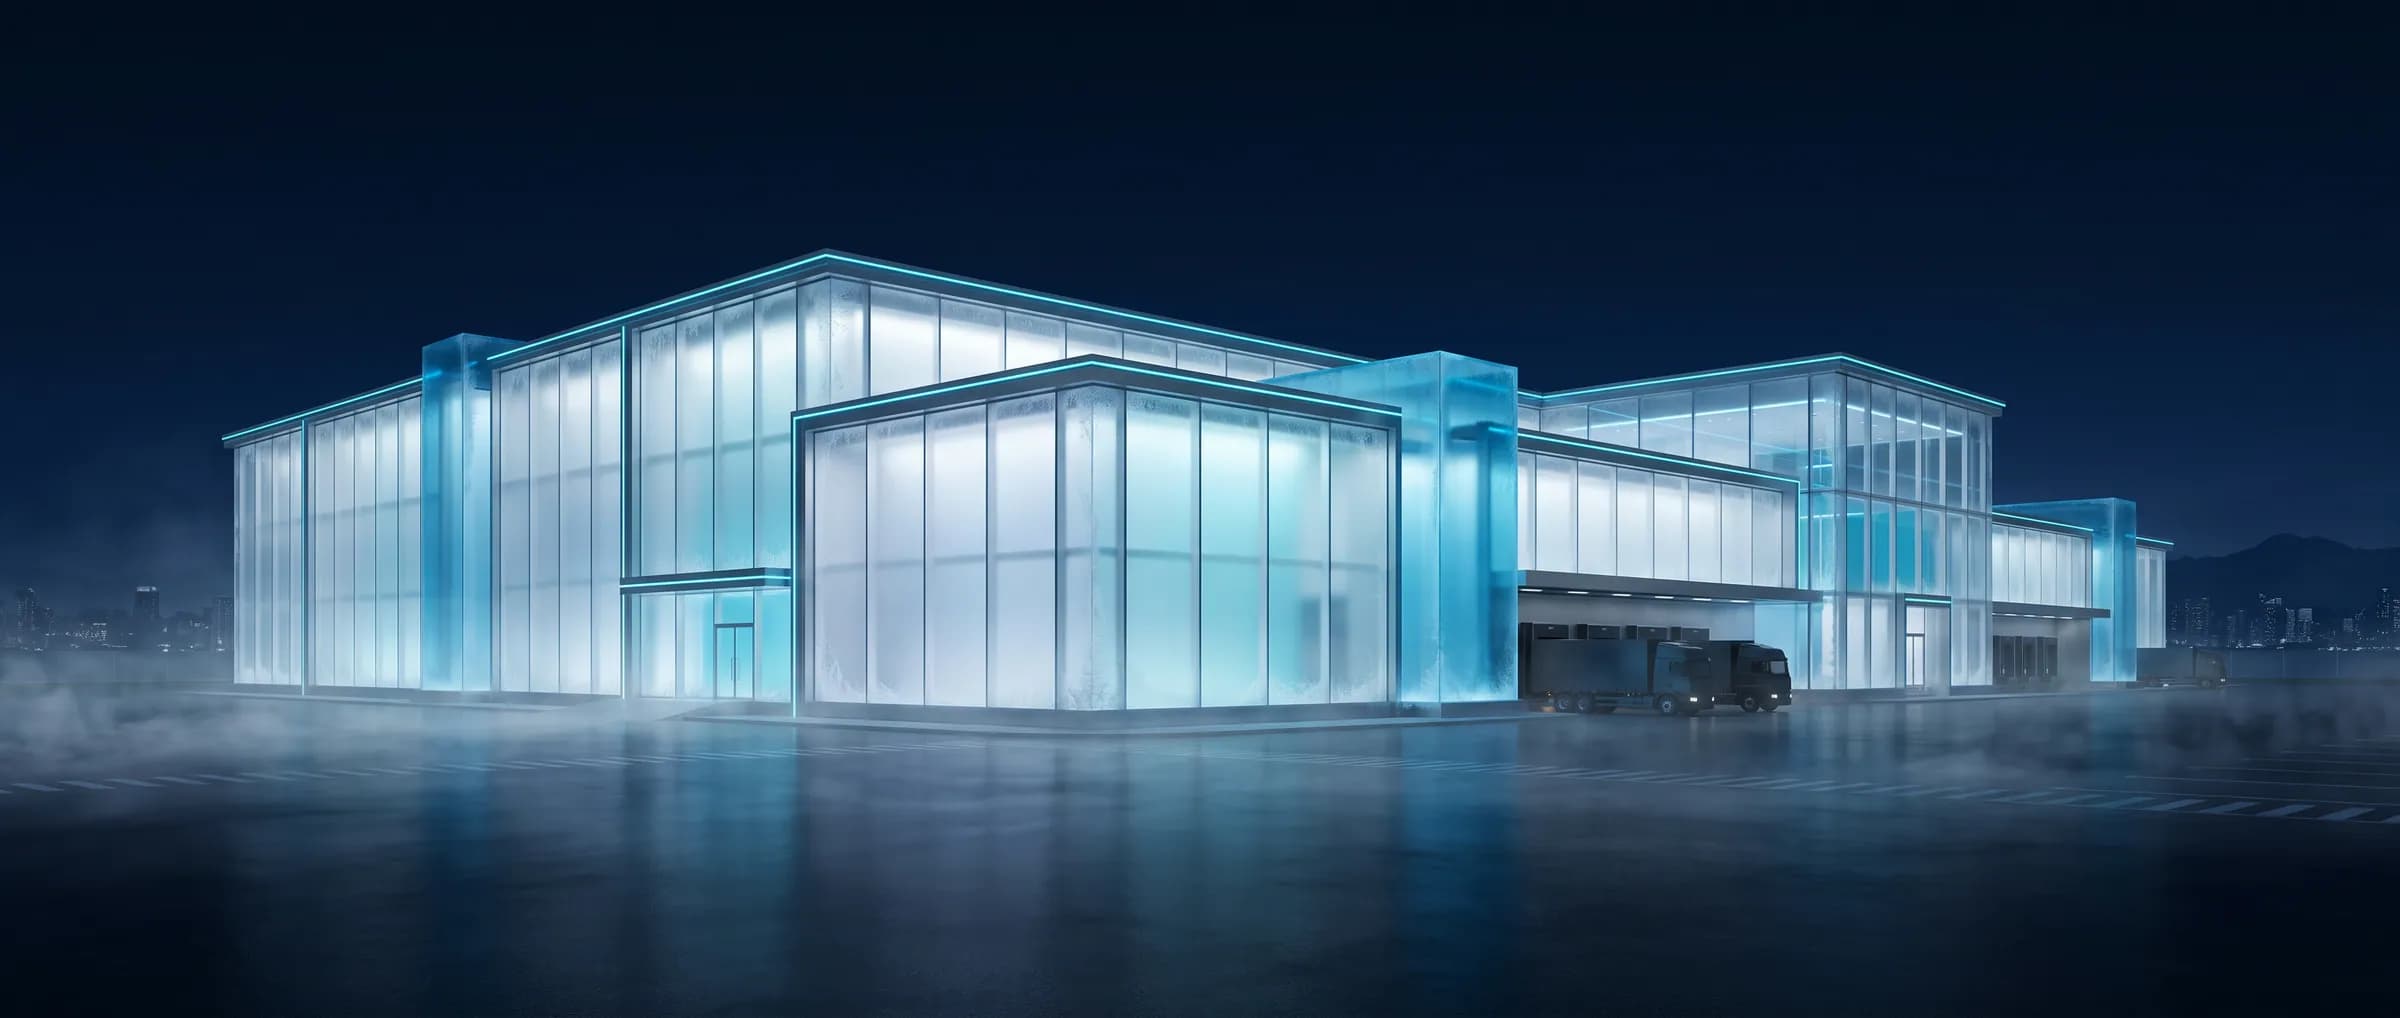

Every warehouse generates a steady stream of information: goods received, items moved, orders picked, stock counted, shipments dispatched. Most of that information lives in tables - transaction logs, inventory lists, and reports. These records are essential, but on their own they can make it surprisingly hard to answer simple questions quickly. Where exactly is that product? Which areas are full? Where are things getting congested?
Warehouse visibility is the ability to understand what is happening in a facility clearly enough to act on it. Improving visibility is less about collecting more data and more about presenting the right data in a way people can understand.
The cost of limited visibility
When visibility is limited, small problems compound. Staff spend time searching for stock. Space is underused in one area while another is overcrowded. Discrepancies between records and physical stock go unnoticed until they cause a missed order. Managers rely on walking the floor or asking around to understand the situation. In temperature-controlled environments, extra searching also means more time inside cold rooms and more door openings.
None of these issues are unusual. They are the natural result of trying to understand a physical, three-dimensional space through flat lists.
What data views do well
Tabular data and reports remain the backbone of warehouse management. They are precise, auditable, and ideal for reconciling stock, reviewing transactions, analysing trends over a period, and producing documentation for customers or finance teams. A good data view lets users filter, search, and drill into records with confidence.
But tables abstract away space. A location code made of rack and level identifiers is meaningful to a system, yet it says little at a glance about how that position relates to the aisles, docks, and zones around it.
What spatial 3D views add
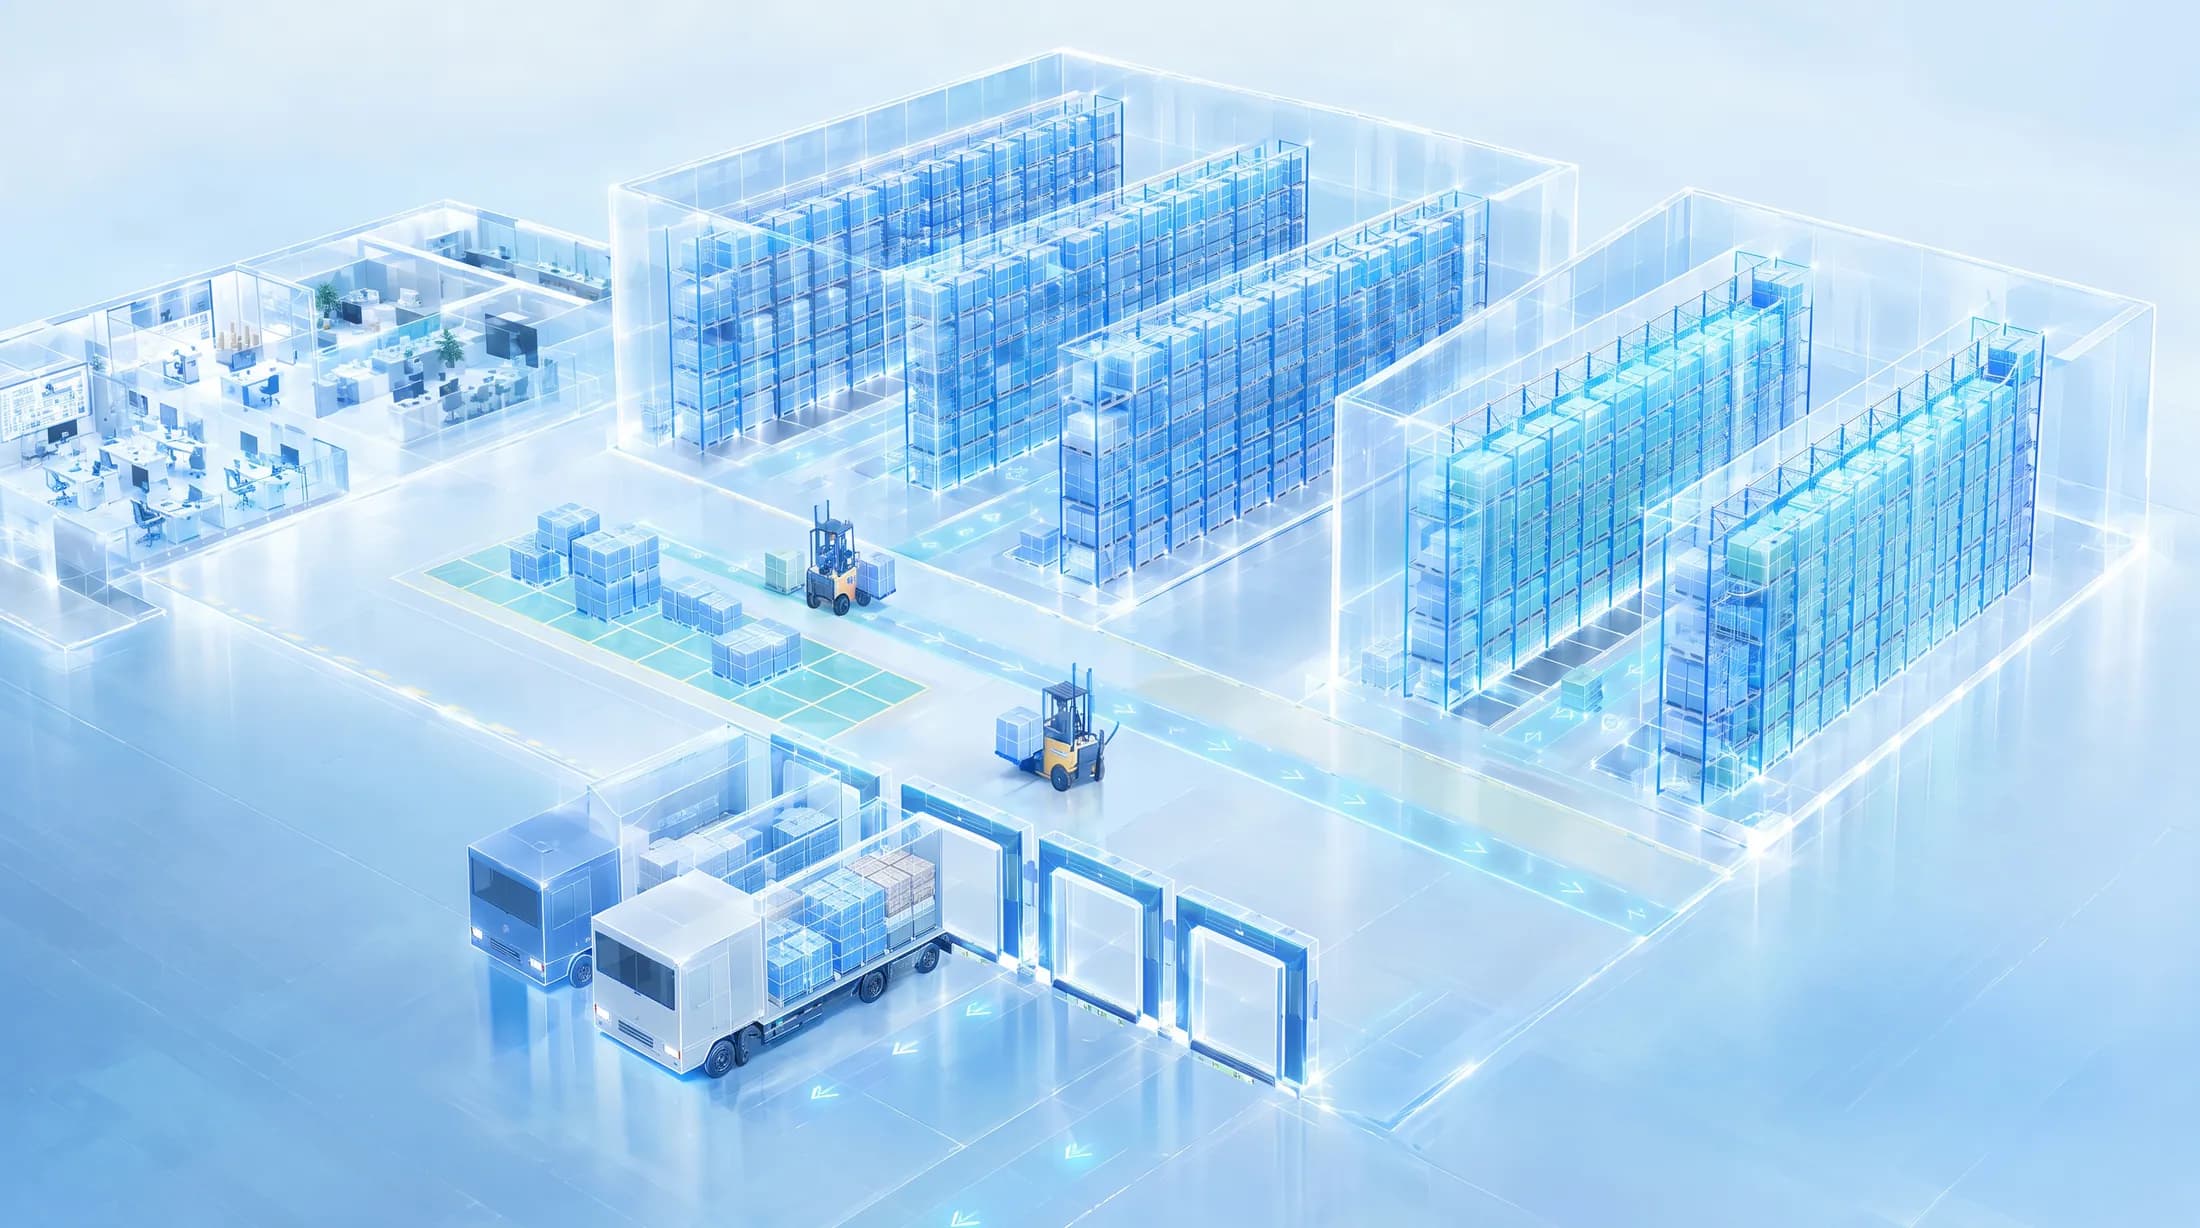
A spatial view represents the warehouse as it physically exists: its layout, aisles, racks, and storage positions. When inventory and occupancy information is mapped onto that model, patterns hidden in a list can become visible immediately - clusters of full locations, empty zones, or the relationship between where goods are stored and where they are dispatched.
Three-dimensional views are particularly helpful in facilities with tall racking, where levels matter as much as floor position. They can also make it easier for people who are less familiar with system codes - new team members, managers, or customers - to understand the state of a warehouse.
Better together
The real value comes from combining both perspectives around the same underlying information. A team might spot an unusual pattern in a 3D view, then switch to the data view to examine the specific records. Or they might begin with a report and use the spatial view to understand the physical context. When both views draw on a consistent data model, users can move between them without wondering whether they are looking at different versions of the truth.
- Data views for precision, records, and reporting.
- Spatial views for layout, location, and occupancy at a glance.
- A shared information model, so both views stay consistent.
Visibility as a habit
Technology supports visibility, but it does not replace good practice. Accurate data entry, consistent location labelling, and regular stock checks are what make any view trustworthy. The goal is a working habit in which teams can look at the warehouse, understand it, and act - rather than search for answers.
This idea is at the heart of how we think about Gudings WVS: bringing warehouse data and spatial visibility together so teams can understand operations from different perspectives. Every warehouse is different, and the right approach depends on its environment and processes - but clearer visibility is a goal worth pursuing in any facility.
Published 16 October 2026